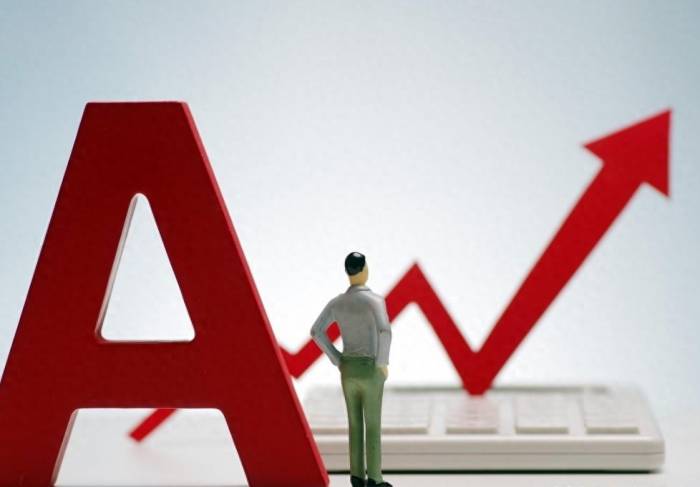
You're watching a stock you own, and suddenly, trading stops. The ticker freezes. A "halt" or "suspension" notice flashes on your screen. Your first question, and the most urgent one, is almost always: How long can a stock stay halted for volatility? The quick, textbook answer is 5 to 15 minutes. But in reality, the answer is more nuanced, and understanding the nuances is what separates panicked investors from prepared ones. A volatility halt can be a brief pause or stretch into hours, depending on the severity of the move and the specific rules triggered. Let's cut through the jargon and look at what actually determines the clock.
What You'll Find in This Guide
What Exactly is a Volatility Halt?
First, let's be clear. A volatility halt isn't a punishment. It's a cooling-off mechanism. Exchanges like the NYSE and NASDAQ have automatic triggers—called Limit Up-Limit Down (LULD) and Market-Wide Circuit Breakers—designed to prevent extreme, disorderly price movements driven by panic or algorithmic errors.
Think of it like a referee blowing the whistle during a chaotic play. The goal is to pause trading, allow information to disseminate, and let buyers and sellers re-establish rational orders. Without these halts, a stock could theoretically crash or soar 50% in seconds based on a fat-finger trade or a misinterpreted headline.
The Circuit Breaker Rules: Levels and Durations
The core system is the Market-Wide Circuit Breaker, coordinated by the U.S. securities exchanges. It's a tiered system based on the decline of the S&P 500 index. This is where you get the famous "market circuit breaker" headlines.
The rules are publicly available on the NYSE website and other exchange sites, but here’s the breakdown in plain English:
| Circuit Breaker Level | S&P 500 Decline | Time of Day Triggered | Trading Halt Duration |
|---|---|---|---|
| Level 1 | 7% from prior close | Before 3:25 PM ET | 15 minutes |
| Level 2 | 13% from prior close | Before 3:25 PM ET | 15 minutes |
| Level 3 | 20% from prior close | Any time during trading day | Trading halts for the remainder of the day |
Notice the critical detail: If a Level 1 or 2 decline happens at or after 3:25 PM ET, trading does NOT halt. The exchange rationale is that there's not enough time for a meaningful cooling-off period before the close. This catches many investors off guard.
For individual stocks, the Limit Up-Limit Down (LULD) mechanism is more common. It pauses a single stock if its price moves outside a specified percentage band (5%, 10%, or 20%, depending on the stock's price and category) within a 5-minute period. These pauses are much shorter, typically 5 minutes. But here's the kicker: if, after the 5-minute pause, there is still a significant order imbalance (i.e., many more sellers than buyers or vice versa), the halt can be extended in 5-minute increments. This is how a "5-minute" halt can turn into 10, 15, or even 20 minutes of frozen trading.
What Makes a Halt Last Longer Than 15 Minutes?
So, a halt stretches beyond the typical window. Why? It's rarely just the simple circuit breaker. In my experience watching these events, a prolonged suspension usually involves a combination of factors.
1. The News Catalyst
A volatility halt triggered by a major, unexpected news event (FDA decision, merger rumor, terrible earnings) is more likely to be extended. The exchange needs to ensure the news is properly disseminated to all investors. If the news is complex or conflicting, the pause gives time for clarification, which can mean multiple 5-minute extensions under the LULD rule.
2. Order Imbalance
This is the technical heart of it. Exchanges aim for an orderly reopen. If, after the initial pause, the buy and sell orders are wildly mismatched, they'll extend the halt. They'll often publish the imbalance during the halt (e.g., "Sell Imbalance: 500,000 shares") to attract opposing orders. No one wants a stock to immediately gap down another 20% at the reopen because there were no buyers lined up.
3. Cascading Halts and Market-Wide Stress
In a true market panic (like the "Flash Crash" of 2010 or the early COVID sell-off in March 2020), many stocks hit their LULD bands simultaneously. This creates systemic stress. While each individual halt might be 5 minutes, the sheer volume of halts and the extreme volatility can make it feel like trading is frozen forever. In these cases, a market-wide circuit breaker (the 15-minute halt) might also be triggered, layering on top of individual stock halts.
Real-World Halt Scenarios and Case Studies
Let's look at two concrete examples to illustrate the spectrum.
Scenario 1: The Quick 5-Minute Pause. A mid-cap biotech stock is trading at $50. A positive Phase 2 trial result hits the wires at 11:05 AM. The stock instantly jumps to $58, a 16% move, triggering its LULD band. Trading halts for 5 minutes. During the halt, the news is widely read, and buy and sell orders are entered. At 11:10 AM, trading resumes smoothly. This is the ideal, textbook volatility halt.
Scenario 2: The Extended, Messy Halt. Remember the GameStop ($GME) saga in January 2021? That was a masterclass in extended halts. On multiple days, the stock would surge 30%, trigger a halt, reopen with massive volatility, and then trigger another halt within minutes in the opposite direction. On January 28, 2021, $GME experienced multiple trading halts throughout the day, some lasting longer than the standard 5 minutes due to extreme order imbalances. For retail traders in the thick of it, it felt like the stock was halted more than it was trading.
Another case was Tesla ($TSLA) during its rapid ascent. Its high volatility often led to LULD pauses. Because the moves were often driven by continuous news flow and intense investor sentiment, the halts sometimes needed extra time to establish a clearing price.
What Should You Do When Your Stock Is Halted?
Don't just stare at the frozen price. Use the time productively.
First, confirm the reason. Check the NASDAQ Trader or NYSE website for official halt codes. "T1" means a news-related halt, "T12" is an additional information requested halt, but "LUDP" or "LULD" points to a volatility pause. Your broker's platform should also show the reason.
Second, hunt for information. Is there a major news headline? Check reputable financial news sources (Bloomberg, Reuters, CNBC). Avoid relying solely on social media rumors, which can be wild during a halt.
Third, assess your order. If you had a market order pending when the halt hit, cancel it. A market order during a volatile reopen is a recipe for a terrible fill price. Consider switching to a limit order with a price you're comfortable with.
Finally, manage your emotions. This is the hardest part. A halt creates a feeling of helplessness. The urge to "do something" is strong. Resist the panic. The halt is there to protect you from the worst of disorderly trading. Use it as a forced moment to think.
In my experience, the biggest mistake retail investors make during a halt is deciding, in a state of panic, to sell at any price as soon as trading resumes. Often, that's the exact moment of maximum fear and the worst possible price.

Comments (0)
Leave a Comment